
Is the graphic design industry growing? you’ll find your answer in this article.
Whether you work in media, retail, government, or technology, there’s always a need for graphic design. Therefore, it’s important to know at least a little about the industry.
Not sure where to start? Good news! I’ve already done the research job for you (based on my years of working experience).
Here, I put together 36 graphic design facts and statistics under 5 different categories, I’ll also explain their impact in different fields like web design, marketing, and branding.
Let’s get started!
Graphic Design Industry Statistics & Facts
How’s the graphic design industry doing? Why is it important? In this section, you’ll find some general graphic design industry statistics and facts.
68% of graphic designers have a bachelor’s degree.
Besides a bachelor’s degree, a big percentage of graphic designers choose to get an associate degree. 3% of graphic designers choose to get a master’s degree, 3% have a high school degree, and the rest have certificates or other degrees.
Most freelancer graphic designers work for private companies.
Around 56% of freelance designers work for private companies and 37% for public companies. The top industry that hires freelancers is retail (20%).
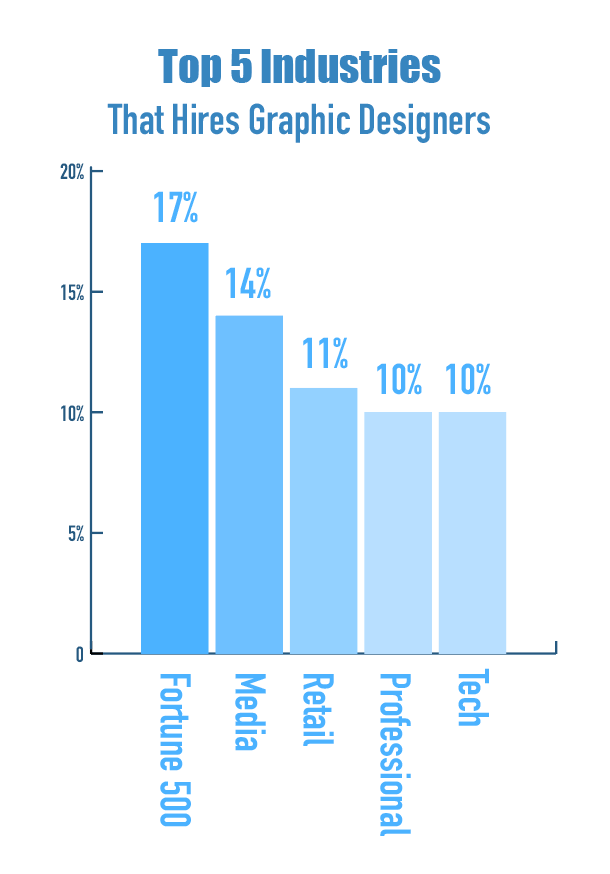
The top 5 industries that hire graphic designers are Fortune 500, media, retail, professional, and technology.
More than 17% of designers work for Fortune 500 companies, followed by media companies at 14%, 11% work for retail, professional, and technology both 10%.
40% of people respond better to visual information than text-only.
That’s why companies use graphic design to advertise their products. Visual information can not only showcase a product but is also easier to remember, in other words, leaves a deeper impression than text.
73% of companies are trying to beat their competitors using design.
There are limited product categories but there are unlimited design options. Adobe’s research shows that about 73% of companies are spending money to improve their design in order to stand out from the competition.
50.2% of graphic designers are female and 49.8% are male.
There wasn’t much gender gap between men and women in the graphic design industry. The latest data showed that the percentage of female and male graphic designers is almost the same. Compared to previous years, there’s significant growth of male graphic designers in recent years.
Advertising and Marketing can’t survive without graphic design.
Posters, ads, social media posts, packaging, etc are all graphic designs. Text-only promotional materials can’t beat visual content because human processes image 60,000 times faster than text.
About 90% of bloggers or businesses with a blog section use images in content marketing.
Research has shown that blogs with at least 10 images can have up to a 39% success rate because images assist readers in better understanding the text content. Of course, the images should be related to the text content. If you use infographics, it can increase the success rate even more.
The average age of a graphic designer in the US is 37.
The graphic design industry statistics show that most graphic designers in the US are over 40 years old (39%). The second age group (34%) is between 30 and 40, followed by the youngest group (27%) between 20 and 30.
Color helps us remember images and brand logos.
According to research by color psychologists, the color itself is 80% brand recognition. We tend to process and remember colorful images better than those that are black and white.
The graphic designers’ industry market size in the US is measured at $16.9 billion in 2024.
The global graphic design market size was valued at $57.5 billion in 2023. This market is predicted to reach $78.25 billion by 2030.
Graphic Design Salary Statistics & Facts
Based on different demographics, experiences, locations, and jobs, the salary can vary. Want to know what’s the best-paying graphic design job or where’s the best place to work? Here are some graphic design salary statistics and interesting facts.
Women earn about 5-6% less than men in the US.
There’s a gender pay gap between male and female graphic designers in the US. On average, men make roughly $52,650 annually while women only make about $49,960.
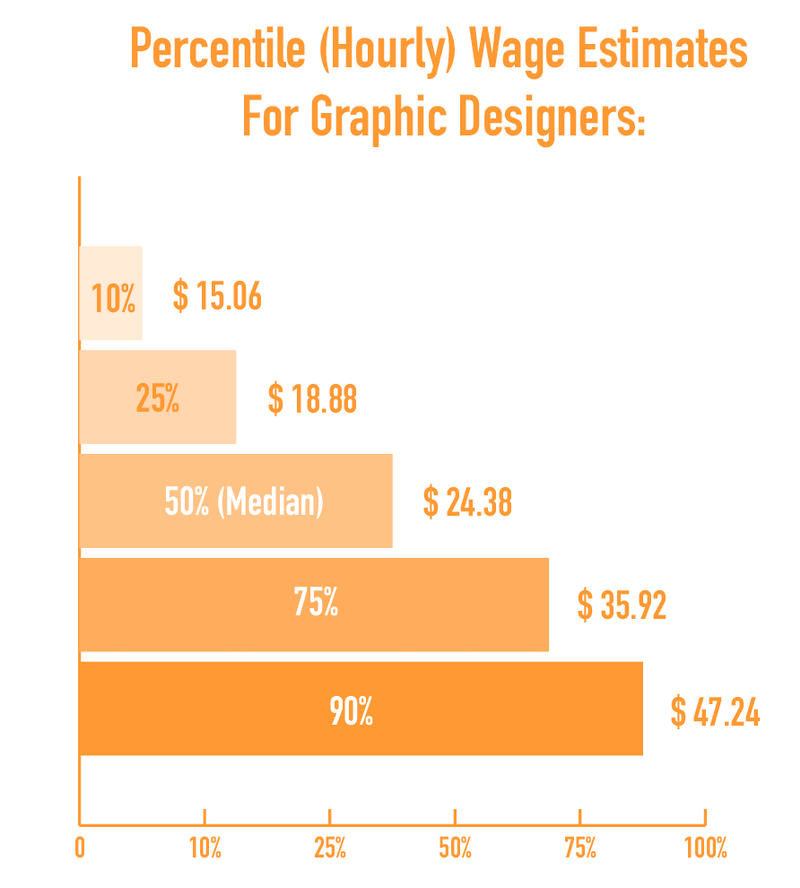
Graphic design rates in the US average at around $27.88 per hour.
The actual salary highly depends on different factors such as your experience, where you work, etc. For example, if you’re a fresh graduate, you’ll make less than designers who have more years of experience. Just to give you an idea, the minimum wage can be as low as $15/h.
Entry-level graphic designers can expect to make $46,900 annually.
The average annual wage for entry-level graphic designers is actually lower than $46,000, roughly about $40,000. However, some industries like technology publishers or monetary companies/central banks, pay more.
Asian Graphic Designers have the highest average salary compared to other ethnicities.
Interesting fact. There are only % of Asian graphic designers and the pay rate is slightly higher than other ethnicities. The average annual salary for Asian graphic designers is $55,000.
The average annual salary for an in-house illustrator is $65,020, which translates to an hourly wage of $31.26 per hour.
Illustrators make slightly more than graphic designers. Makes sense, an illustrator can take more effort than for example, designing a business card or poster.
The best-paying graphic design positions are art director, creative director, senior designer, user experience director, UI and UX designers.
These positions require more years of experience and education level. According to the Bureau of Labor Statistics, the average salary of an art director with a BA degree is $70,000 to $110,000 depending on the level (entry-level: between $60,000 and $75,000 annually, mid-level: from $75,000 to $90,000, and experienced: $90,000 to $120,000 or more).
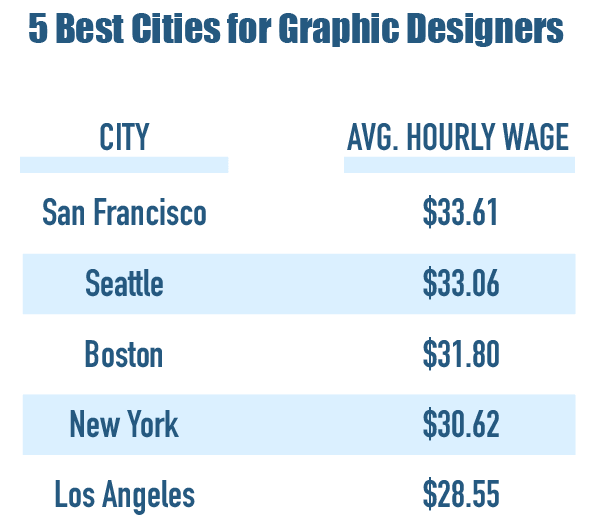
The 5 best-paying cities (in the US) for graphic designers are: Seattle, San Francisco, Los Angeles, New York, and Boston.
Graphic Design/Visual Content in Marketing Statistics & Facts
Visual content such as infographics, images, and videos have a huge impact on marketing and it can affect user engagement and sales. Here are some useful visual content statistics that can be useful for your marketing strategy planning.
Color influences 85% of shoppers’ purchase decisions.
Color is the first thing that attracts attention and it affects consumer behavior in many ways. For example, impulsive shoppers are the most affected group and research shows that warm colors like red influence their purchase decision more because these colors suggest urgency.
32% of marketers say it’s important to use visual content for their businesses.
It’s hard to sell text content alone. Infographics and other colorful visuals can increase sales by up to 80%.
65% of brands use infographics for marketing purposes.
According to research and studies, infographics can drive website traffic by 12% and are easier to learn and memorize than text-only content.
Infographics get more likes and are shared on social media.
Infographics are shared and liked three times more than other visual content on social media. Fitness routine, meal plan, data report, etc, you name it. Sharing information via an image that explains the context well is more effective than sharing text on social media.
67% of online shoppers rated high-quality images as being “very important” to their purchase decision.
That’s why a lot of businesses pay extra attention to their marketing materials. For example, catchy copywriting, choice of color & font, and eye-catching graphics are all crucial.
Web Design Statistics & Facts
Whether you own an e-commerce site or simply a portfolio to show your work, having a well-designed website is a plus. Of course, content quality is the key, but the design helps a lot as well. Here are some statistics and interesting facts about web design.
94% of people will leave a website with a bad design.
And what’s the first impression of a bad design? Layout and feature images on your homepage! Remember, it only takes 0.05 seconds to make a first impression, and you’ll want to leave a good impression.
Around 50% of internet users say that website design has a great impact on their opinion about a brand.
Color definitely plays a role. Following the trend is also important because the outdated design can somehow tell a visitor that you’re not updating your content. The majority of people like to see what’s new.
Consumers prefer to see the colors blue and green in web design.
Blue is probably the safest color to use not only because it’s associated with trust, reliability, and security, but it’s also the favorite color of the majority of the population.
Green is another preferred color and it’s the most popular color for food or wellness brands because it’s highly associated with growth, nature, and health. It somehow also represents approval. Think about it, a green light or sign almost always means it’s a pass.
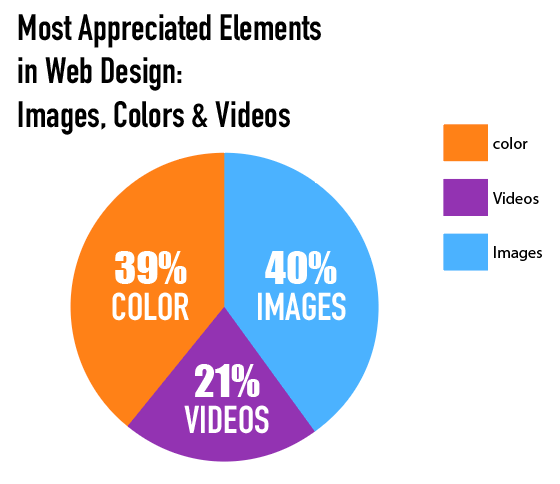
The elements consumers appreciate the most in website design are photos and images, color, and videos.
Photos and images take up 40%, color 39%, and videos 21%.
People spend an average of 5.94 seconds looking at a website’s main image.
That’s why businesses use eye-catching feature images on their homepage. If you make your main image more interesting and engaging, people will spend more time looking at it and are more likely to click on other pages.
High-quality images get more attention.
High-quality images show professionalism. If you have pixelated images on your website, it somehow shows that you’re not “taking care” of your brand image.
A study shows that when your image includes a seemingly approachable “normal” person, it attracts more attention than if it includes a model.
Branding Statistics & Facts
Graphic design plays an essential role in branding because it tells consumers what you do and who you are. Logos, colors, and authentic and consistent brand design can not only attract attention but also build trust.
Here are some facts and statistics about the importance of graphic design in branding.
A graphic design student created Nike’s logo for $35.
Nick’s logo was designed by Carolyn Davidson, a graphic designer from Portland State University. Although she only got a $35 payment initially, years later, eventually she was rewarded with $1 million.
Rebranding your logo can have a huge impact on your business.
Besides the business model, re-branding also means changing visual content, and very often, adjusting the logo. For example, Heinz changed the color of its ketchup from red to green, and the sales increased by $23 million.
Read: 19 Logo Statistics and Facts You Should Know
Logo and branding design make up $3 billion of the total graphic design market.
A report shows that the global market size of specialized design services will grow from $147.18 billion in 2023 to $156.92 billion in 2024.
29% of consumers say creativity is the most important thing about a brand.
And how do you show creativity? Content is one way, but the most effective way is through designs! Creative web design, ads, and illustrations always help.
Color improves brand recognition by up to 80%.
It’s psychology! Color can trigger emotions and people usually associate your brand color with your product or service. That’s why different industries have certain “stereotype” colors associated with them.
About 33% of the world’s top 100 brands include the color blue in their logos.
What’s the first logo with blue color that comes to your mind? Pepsi? Facebook? Google? IMB? You name it. What do they have in common? They use the color blue in their logos!
Why blue? Studies have shown that blue is associated with reliability, trust, and security. Around 35% of women and 57% of men include blue as their top favorite colors.
86% of customers say that brand authenticity affects their decisions in choosing and endorsing the products they want.
People like customized content which is associated with authenticity in a way because it’s showing how much effort a brand put into its product. Authentic branding should be consistent and consistency builds trust. Eventually will lead to forming a loyal customer base.
67% of small businesses are willing to pay $500 for a logo design, and 18% are willing to pay $1000.
A logo is something that shows a brand image at a glance. A professional logo automatically reflects the authenticity of a brand. That’s why it’s important to create a unique logo.
Wrapping Up
I know it’s a lot of information, so here’s a quick sum up.
I can’t tell you how many graphic designers are there in the world but, the graphic design market is for sure growing and there will be a demand for graphic designers in different companies.
The average salary statistics are for reference. Actual salaries are based on positions, locations, skills, and other factors.
Graphic design has a huge impact on marketing, web design, and branding. You can apply some of the statistics and facts to your business.
References
- https://www.zippia.com/graphic-designer-jobs/demographics/
- https://www.office.xerox.com/latest/COLFS-02UA.PDF
- https://www.webfx.com/web-design/statistics/
- https://cxl.com/blog/stock-photography-vs-real-photos-cant-use/
- https://venngage.com/blog/visual-content-marketing-statistics/
- https://www.bls.gov/oes/current/oes271024.htm