
Where is the table tool in Adobe Illustrator? Unfortunately, you wouldn’t find it. However, there are different tools you can use to make a table chart in Adobe Illustrator.
For example, you can quickly make a table frame using the Rectangular Grid Tool, Line Segment Tool, or splitting a rectangle into grids.
Actually, drawing the table frame is easy using any of the methods below. What takes more time is filling the table with text. You’ll see why later on.
In this tutorial, you’ll learn three easy ways to create and add text to a table in Adobe Illustrator along with some table editing tips.
3 Ways to Make a Table in Adobe Illustrator
Drawing lines (Method 1) is probably the most traditional way to insert a table in Illustrator. It takes longer but it gives you more control over the spacing between table cells.
Methods 2 and 3 are much quicker but with limitations because when you use methods 2 and 3, you’re basically creating grids and they will be divided evenly. Well, I’m not saying that’s bad. Plus, you can always use the Direct Selection Tool to adjust the spacing.
Anyway, I’m going to show you the three methods in detailed steps and you can decide which one works best for you.
Note: the screenshots from this tutorial are taken from Adobe Illustrator CC Mac version. Windows or other versions can look different.
Method 1: Line Segment Tool
Step 1: Use the Line Segment Tool (keyboard shortcut \) to draw a horizontal line. The line length is the total length of the table row.
Before moving on to the next step, you should decide how many rows you want to create on the table.
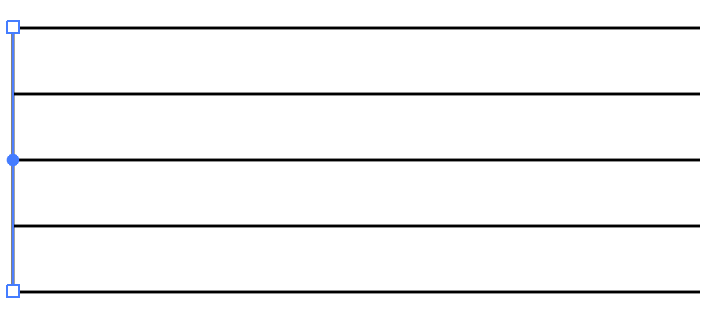
Step 2: Select the line you just created, hold the Option (Alt for Windows users) and Shift keys, and drag it down to duplicate it multiple times. For example, if you want to have four rows, duplicate them four times so there are five lines in total.

Tip: If you’re creating a lot of rows or columns, you can use step and repeat to duplicate faster.
Step 3: Draw a vertical line at the edge of the starting points of the horizontal lines.
Step 4: Duplicate the vertical line and move it to the right at any distance you like to create the first column.
Keep duplicating the line until you have the number of columns you need and you can decide the distance between columns (This is what I meant by having more control over the spacing).
The last vertical line should be at the ending points of the horizontal lines.

Step 5 (Optional): Join the lines of the table frame. Select the top and bottom horizontal lines and the left and right vertical lines at the edge. Hit Command (or Ctrl for Windows users) + J to join lines and make it a frame instead of separate lines.
Now if you want to make a table with even rows and columns, you can try the methods below.
Method 2: Split into Grid
Step 1: Use the Rectangle Tool (keyboard shortcut M) to draw a rectangle. This rectangle is going to be the table frame, so if you have a specific requirement for the table size, set the rectangle to that size.

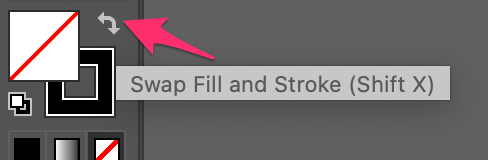
I recommend getting rid of the fill color and choosing a stroke color so that you can see the table clearer in the next steps.
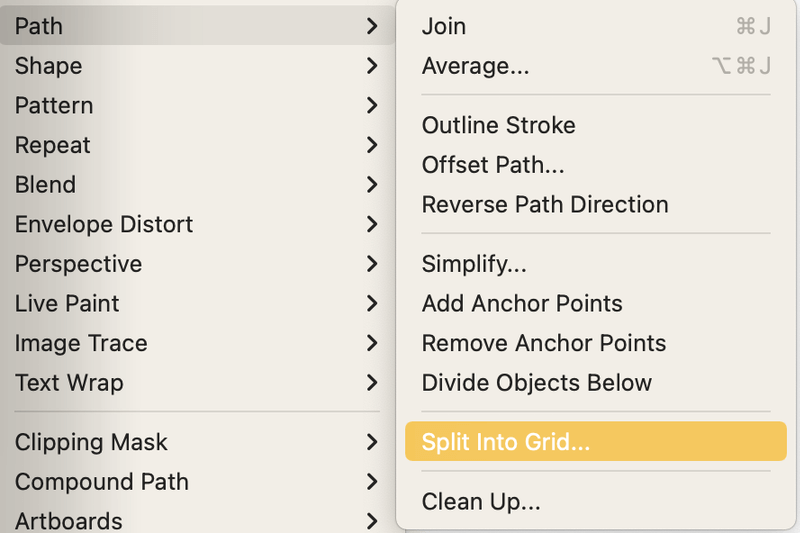
Step 2: Select the rectangle, go to the overhead menu, and choose Object > Path > Split into Grid.
It’ll open up a setting window.
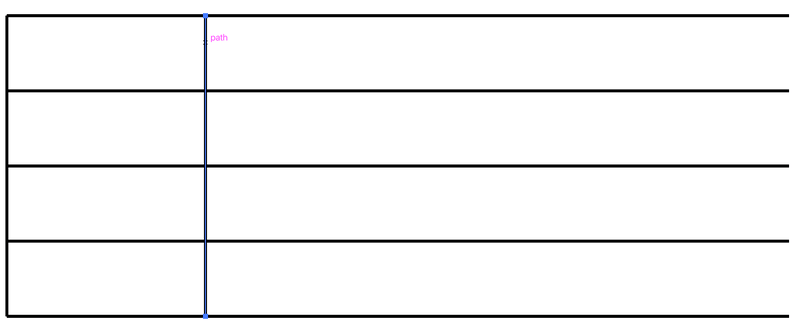
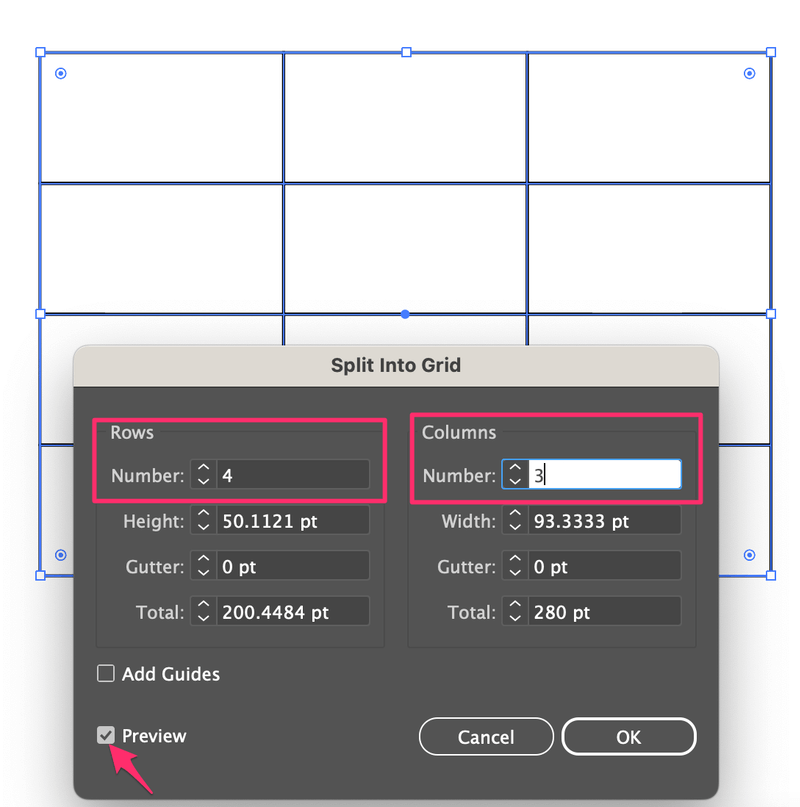
Step 3: Input the numbers of rows and columns you want. For example, here I put 4 rows and 3 columns. You can check the Preview box to see how the grid (table) looks as you change the settings.
Click OK and you can see a table. But we’re not done yet because the grids are separated.
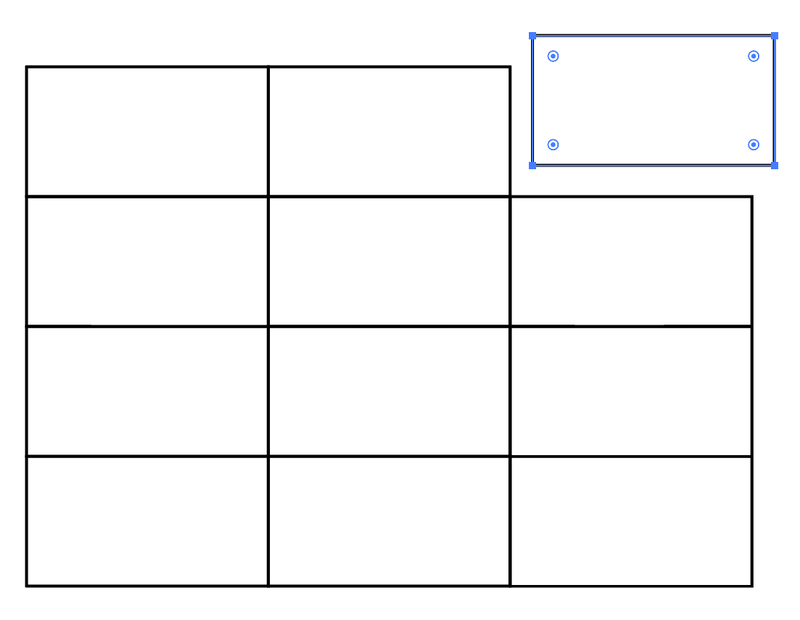
Step 4: Select all the grids, and use the keyboard shortcut Command (or Ctrl for Windows users) + G to group them.
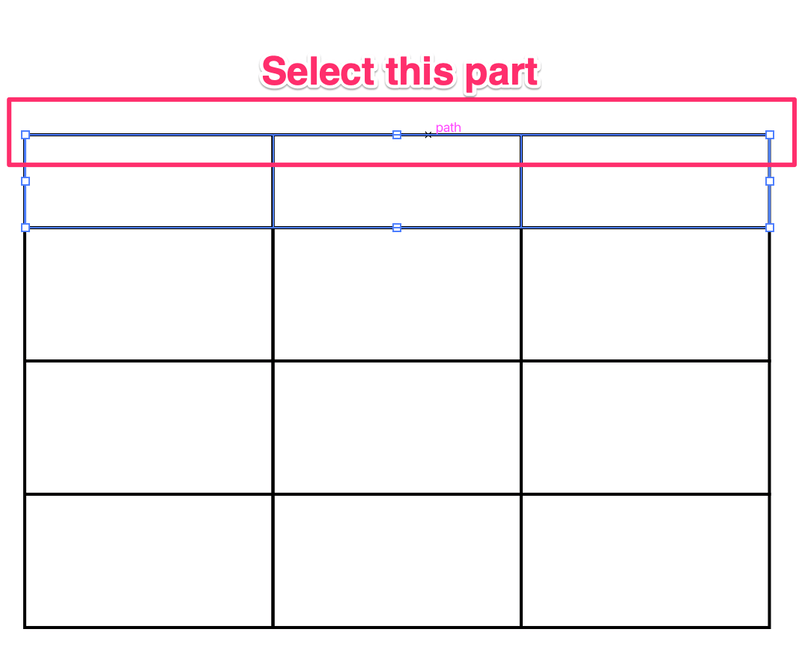
Quick tip: If you want to make the top row narrow, use the Direct Selection Tool (keyboard shortcut A) to select the top edges of the grids, hold the Shift key, and drag downward to narrow the row.
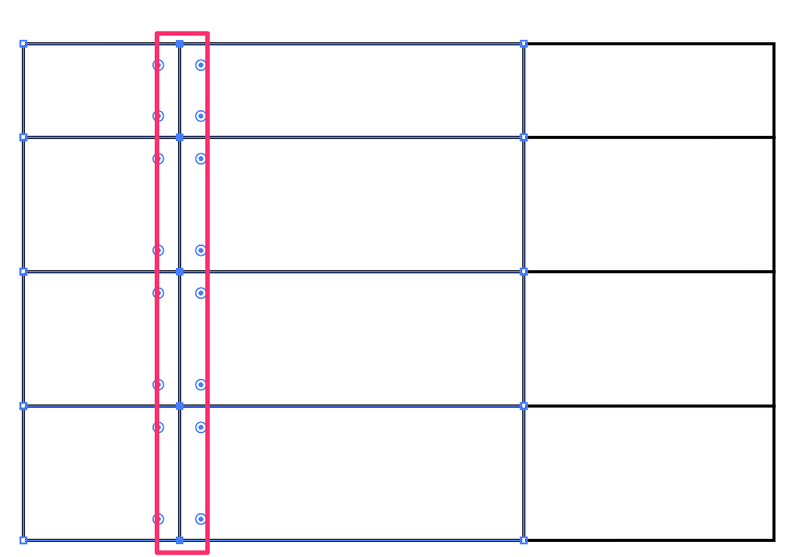
If you want to change the spacing between other rows or columns, select the edge lines, hold the Shift key, and drag to adjust the spacing.
Now, there’s another quick way to create grids to make a table.
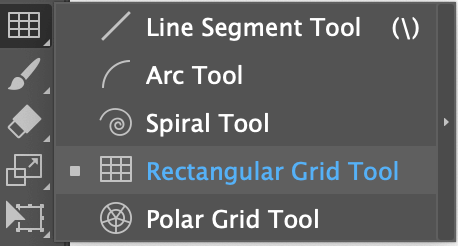
Method 3: Rectangular Grid Tool
Step 1: Choose the Rectangular Grid Tool from the toolbar. If you’re using the Advanced toolbar, it should be in the same menu as the Line Segment Tool.
Step 2: Click and drag on the artboard and you’ll see a rectangular grid. As you drag, you can use the arrow keys to control the number of columns and rows.
Do NOT let go of the mouse when you hit the arrow keys.
The left and right arrows control the number of columns. The up and down arrows control the number of rows.
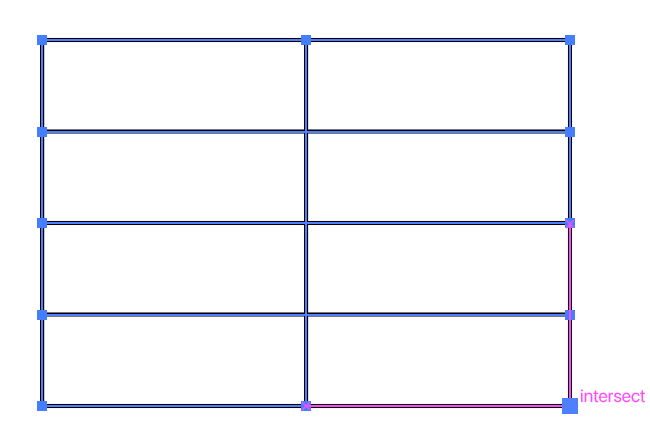
You can add as many columns and rows as you need.

Same thing as above, you can use the Direct Selection Tool to adjust the spacing if you need. You can also change the stroke weight of the table frame from the Properties panel.
Now that we’ve created the table, it’s time to add the data.
How to Add Text to Table in Adobe Illustrator
I bet you already tried clicking inside the table cell to type, right? I definitely, did. Well, that’s not how it works to create a text table in Adobe Illustrator.
Unfortunately, you’ll need to manually type in all data. Yeah, I also wonder why creating a table in Adobe Illustrator isn’t as convenient as creating a graph.
So here’s how it works.
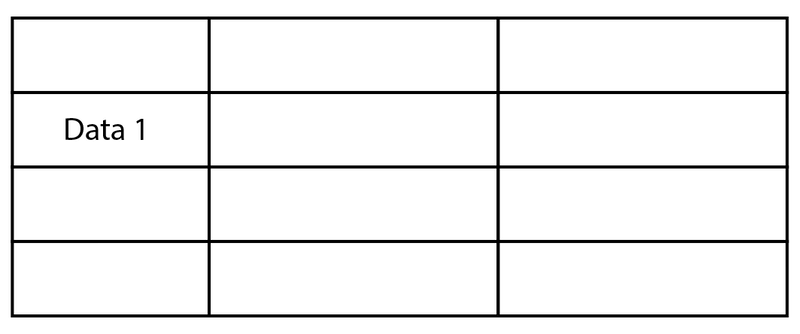
Step 1: Use the Type Tool (keyboard shortcut T) to add text and move it to a cell. Don’t worry about the text content right now, because we’re going to create a text template first.
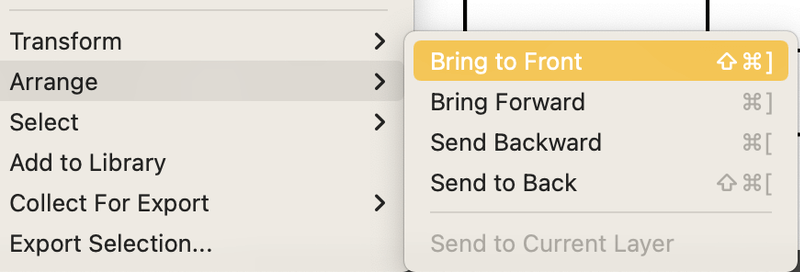
Step 2: Select the text, right-click, and choose Arrange > Bring to Front.
Step 3: Select the text and duplicate it to the cells where you’ll use the same text style. If you’re using the same text style on the whole table, then duplicate the text to all cells in the table.
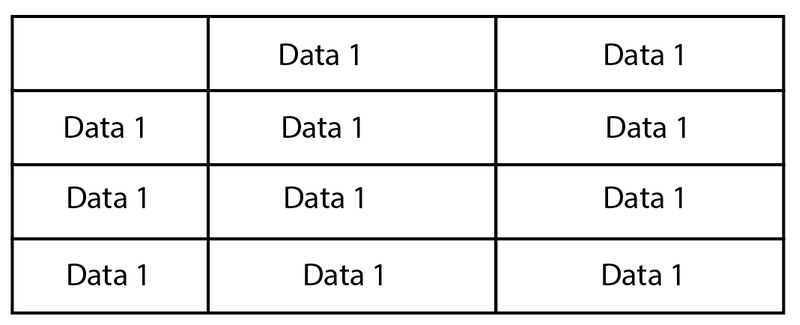
As you can see, the text position isn’t organized, so the next step is to align the text.
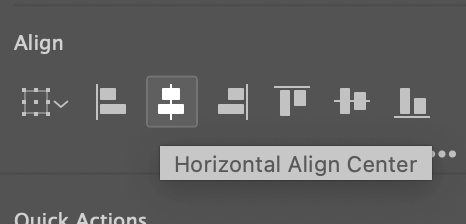
Step 3: Select the text from the first column, and choose how you want to align the text from the Properties > Align panel. For example, I usually center-align the text.
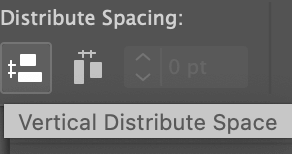
You can also evenly distribute the spacing between the text.
Repeat the same process for the rest of the columns and when you’re done, use the same method to vertically align the text on each row.
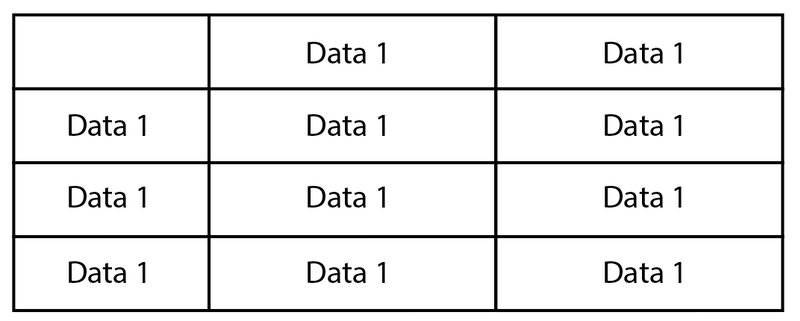
Step 4: Change the text content on each cell.
That’s it.
I know, it’s not very convenient to work with text.
FAQs
Here are more questions related to creating a table in Adobe Illustrator.
How to copy a table from Microsoft Word to Adobe Illustrator?
If you want to use a table from a Word document, you’ll have to export the table as a PDF in Word and place the PDF file in Adobe Illustrator. If you directly copy the table from Word and paste it into Adobe Illustrator, only the text will show.
How do I copy an Excel table into Illustrator?
You can copy the table in Excel as an image and paste it into Adobe Illustrator. Or use the same method as copying a table from Word – export it as a PDF because Adobe Illustrator is compatible with PDF files.
Where is the Table option in Adobe?
You won’t find a table option in Adobe Illustrator, but you can easily create and edit a table in InDesign. Simply go to the overhead menu Table > Create Table, and you can click on each cell to add data directly.
If you need to use the table in Illustrator, you can copy the table from InDesign and paste it into Illustrator. You’ll be able to edit the text in Adobe Illustrator.
Final Thoughts
Even though it’s easy to create tables in Adobe Illustrator, it’s not 100% convenient to work with the text part. Let’s say, it isn’t “smart” enough. If you use InDesign as well, I highly recommend creating the table in InDesign (with data) and then editing the table appearance in Adobe Illustrator.