I’ve been a graphic designer for over ten years and I’d say making an infographic in Adobe Illustrator is one of the most challenging tasks. Knowing how to make a good infographic is essential to show your skill as a graphic designer.
Designing an infographic isn’t just about putting together information and making it look nice. The graphic, layout, and text content should show the main points of your message and can be easily understood.
In this article, you’ll learn the basics of infographic design in Adobe Illustrator and some inspiration tips based on my personal experience.
What is an Infographic
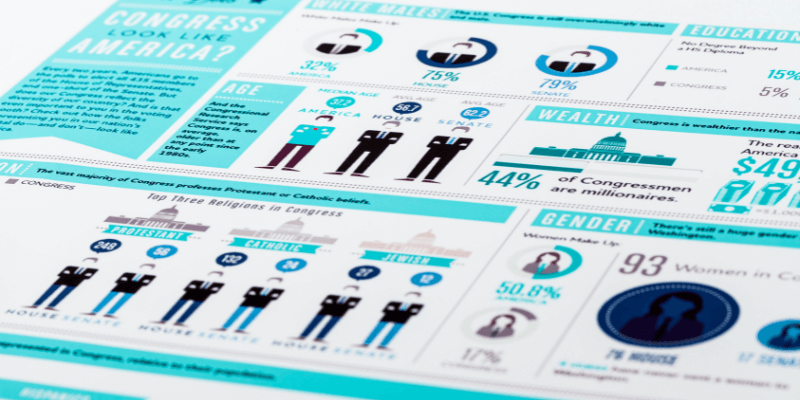
Skip the technical words – infographics are images that contain information and graphics that help you better understand the context. The main goal of an infographic is to show information quickly and efficiently.
According to graphic design statistics, Visuals content, including infographics, is processed 60,000 times faster in the brain than text, and infographics are liked and shared on social media platforms three times more than any other type of content.
How to Design an Infographic in Adobe Illustrator: Steps & Tips
Here are some essential steps and tips to get better at making infographics.
1. Get your information ready
As I briefly mentioned above, infographics aren’t just about beautiful graphics and blocks of text. So it’s essential to gather the key information and create a logical outline of the text content. Does the text make sense? Will people get the information?
Tip: Try to keep the information as precise as possible and avoid a huge block of text. Having too much text will not only affect the visual presentation but also affect the purpose of an infographic.
At the same time, when you plan the text, it’s a good idea to think about the graphic that goes with it. This will simplify your process when designing the graphics.
2. Create a layout
Setting up your document is an essential part of designing infographics in Adobe Illustrator.
If you’re creating a layout from scratch, you should start with a wireframe, sketching out the sections like text boxes, shapes, graphic placements, etc.
Then you will decide on the document size and orientation – whatever makes the most sense. For example, when you create an infographic that of a timeline, perhaps a horizontal artwork is easier to read, so in this case, you can change the document orientation to horizontal.
Once you have the sections and layout clear, you can go ahead and start working on each section and block. Start using the shape tools to create shapes for each section. You can use the Rectangle Tool or Rounded Rectangle Tool briefly create the sections like this.
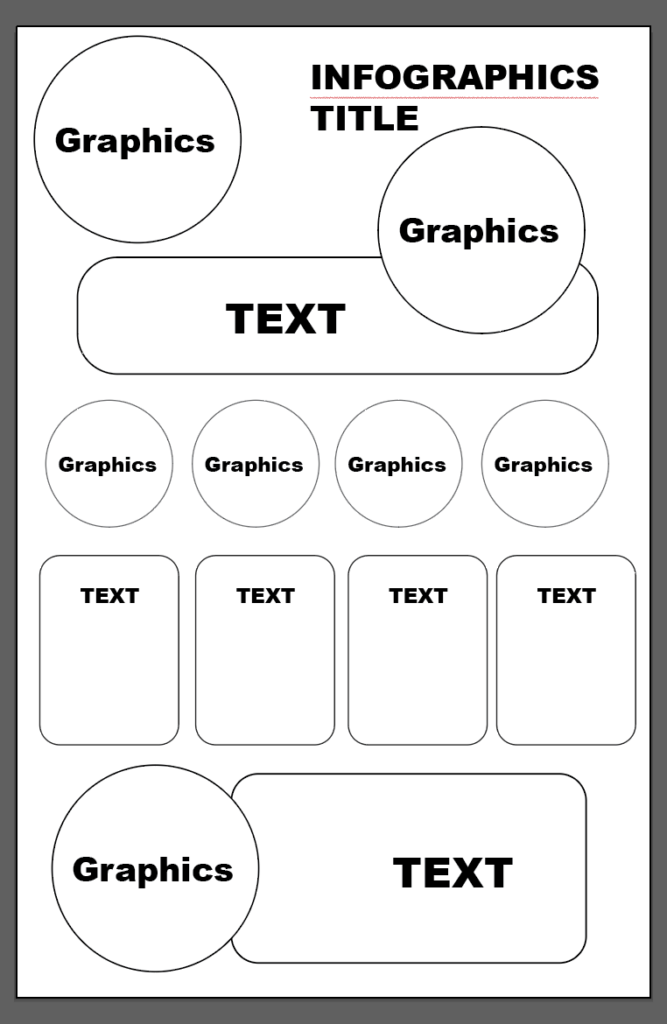
Note: An infographic layout isn’t the same as a publication layout design. The main context of an infographic should be graphics and the text content should be somehow “stylish” too. So it’s not just putting together the text and images. You’ll actually need to design them.
3. Design graphics and typography
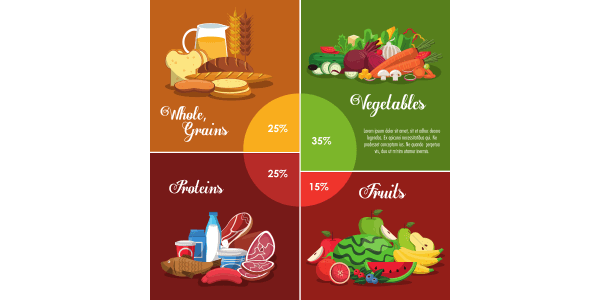
An infographic should include visual elements like icons, illustrations, shapes, graphs or charts, and typography. For example, if you’re making an infographic for a manual or how-to guide, you’ll want to use illustrations or vector graphics together with text to deliver the message.

There are many ways to create shapes in Adobe Illustrator. You can create icons by vectorizing an image or using the pen tool to trace an image. Otherwise, the Pathfinder tools and Shape Builder Tool are also great for making shapes.
Typography is another important element of graphic design. Using the right font, and font size to show different text content can really affect readability.
Using the right theme for your infographic is also essential. You should think about what kind of elements to use, the colors that are associated with the topics, etc.
Tip: If you don’t know what color to choose, you can search for an image related to the topic and use the Eyedropper Tool to sample colors. You can also create a color palette from the sampled color so that you can easily apply the colors to your infographic and other related design.
4. Finalize the design and make adjustments
Once you have the basic outline of the design, you can add more detailed elements like background color, textures, or decorating shapes. Adding arrows and quotes can also catch attention and better direct the viewer.
The most important thing is to see if everything makes sense. Does the graphic match the text content? Is the typeface easy to read? Can you get the information by looking at the graphic and text?
Tip: After making sure everything is okay, you can ask someone else to see it and let you know if it makes sense.
FAQs
Here are more questions related to making infographics in Adobe Illustrator.
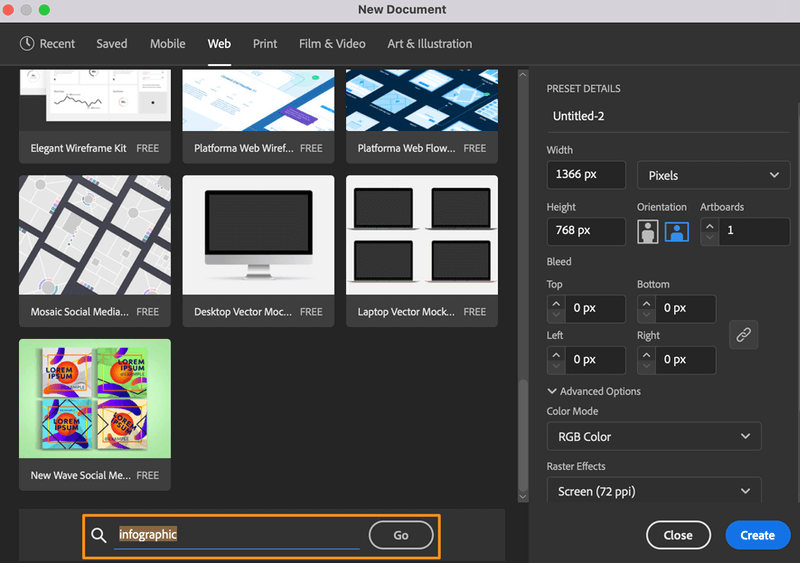
Does Illustrator have infographic templates?
Yes, you can find infographic templates for Adobe Illustrator from Adobe Stock. When you create a new document, at the bottom of the preset templates, you can search “infographics” and it will take you to Adobe Stock.
Should I use Photoshop or Illustrator to make infographics?
Technically, you can use either Photoshop or Illustrator to create infographics, but it’s highly recommended to use Adobe Illustrator because it’s a vector-based program and it’s much easier to work with typography and create vectors and graphs.
Is PNG or JPG better for infographics?
PNG is better for infographics while JPG is better for photographs.
What to avoid when making an infographic?
Avoid using a huge block of text, too many colors, and graphics that don’t make sense.
Final Thoughts
Won’t lie, it’s not easy to make infographics as a beginner and I think the hardest is to select the key text content and combine it with the graphic you’ll design to create something that makes sense.
Hope this article is helpful for your infographic design process. Let me know if you have any questions in the comment section below.